Automatic DCA
Decline curve analysis (DCA) is a graphical procedure used for analyzing declining production rates and forecasting future performance of oil and gas wells. Oil and gas production rates decline as a function of time; loss of reservoir pressure, or changing relative volumes of the produced fluids, are usually the cause. Fitting a line through the performance history and assuming this same trend will continue in future forms the basis of DCA concept. It is important to note here that in absence of stabilized production trends the technique cannot be expected to give reliable results

The algorithm for automatic DCA has been developed internally. it is based on scanning the production data after filtering on months with sufficient production data (24 days - it could evolve) The algorithm will scan the history starting from the last point trying to find the best fit. based on the specified parameters. The DCA workflow respects the internal rules (GM). It is done vs cumulative, after filtering the relevant data.
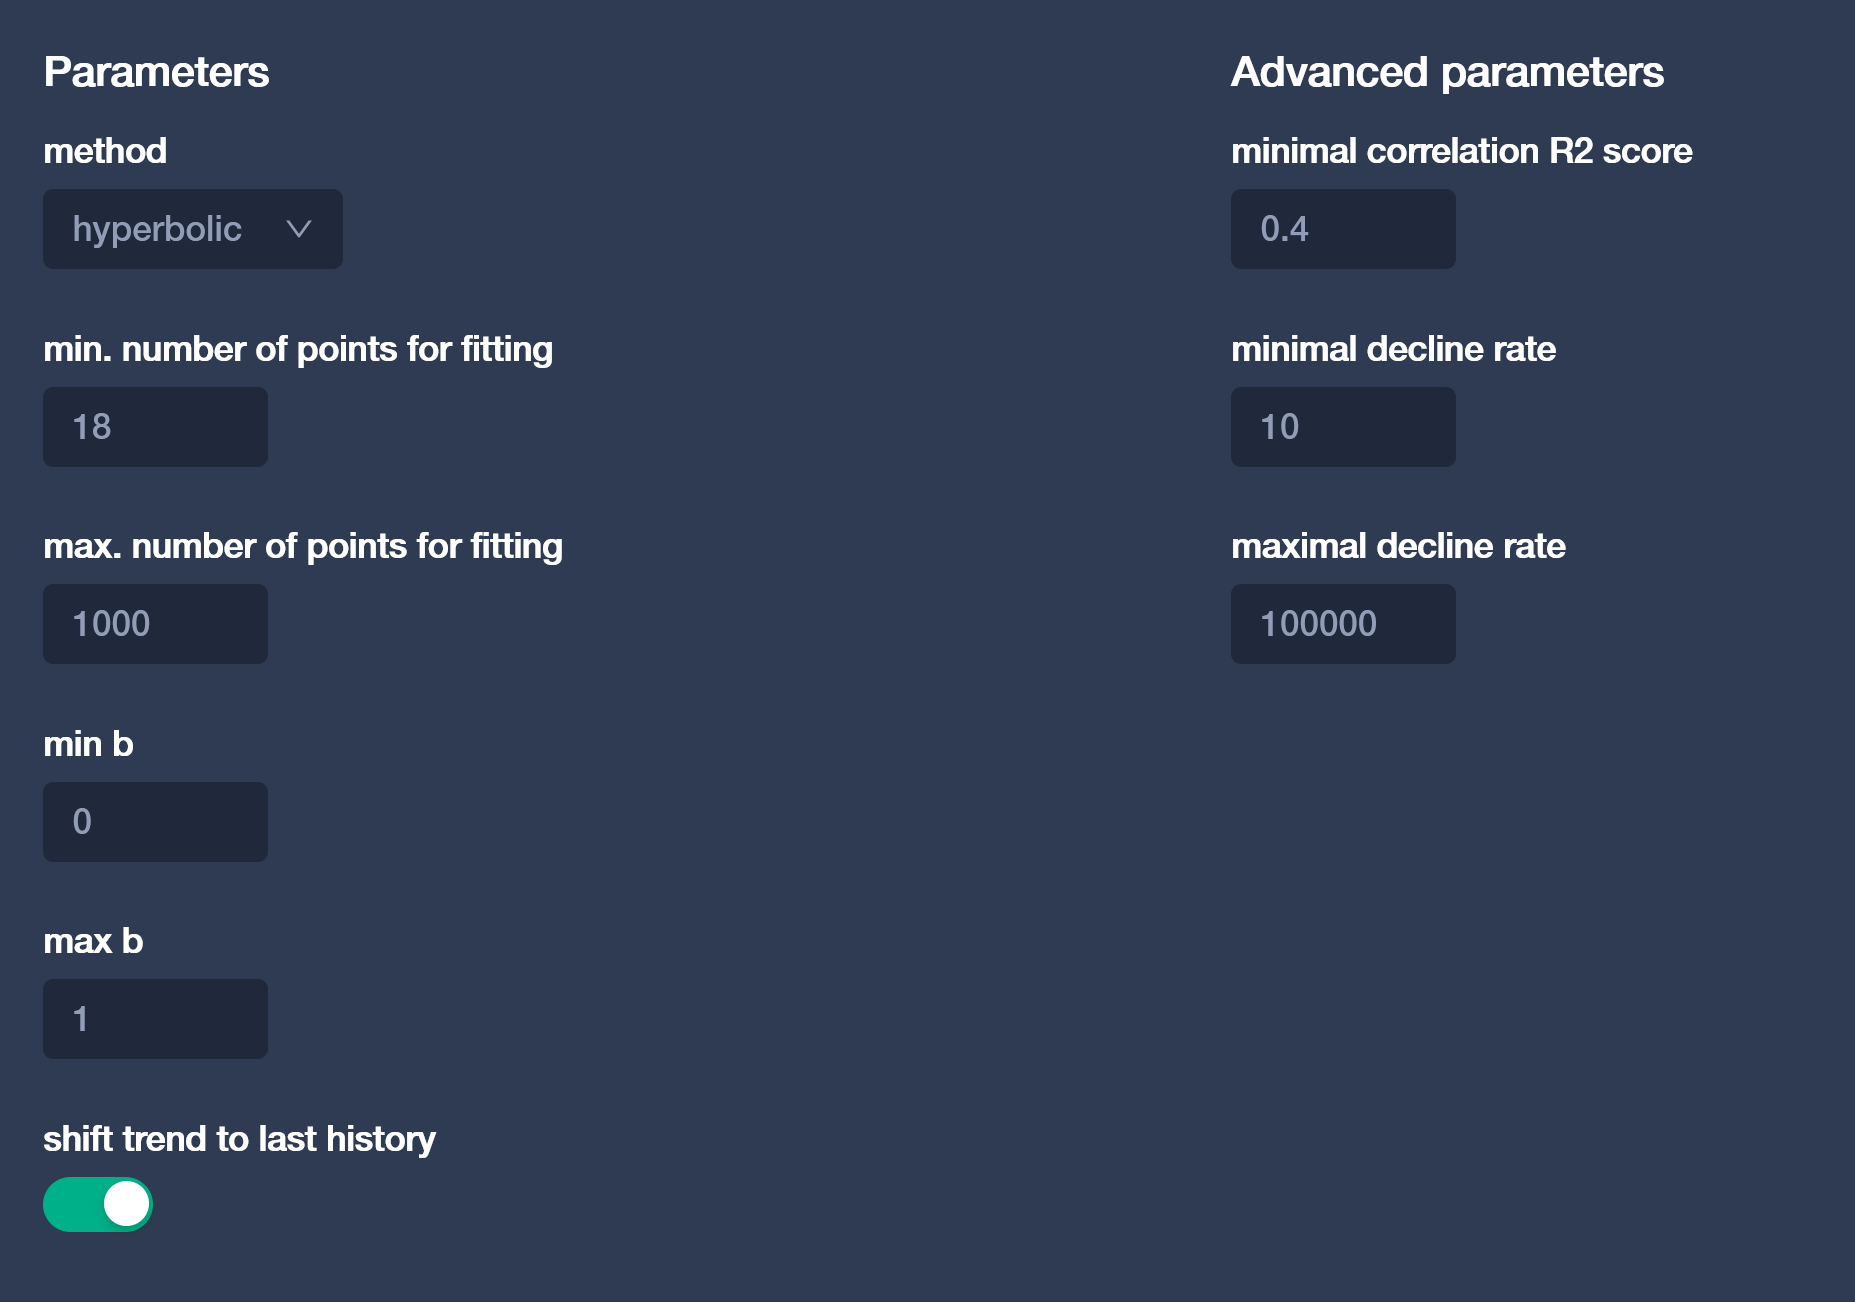
- The parameters that control the algorithm behavior:
fit method: exponential / harmonic / hyperbolic
min and max fitting period: allows to focus on the last period or the overall well trend, expressed in months.
b range: will work only if the selected method is hyperbolic. It is provided giving bmin and bmax
It needs some requirement in order to accept the fit:
- Acceptation criteria:
Minimum fit quality (R2) - minimum R2 between fitted points and real data
D parameter range (minimum and maximum D parameters - to avoid too flat curve or unrealistic decline.
The wells that does not satisfy the acceptance criteria would not be forecasted in dca and will be forecasted by the following forecaster (analog wells, …)
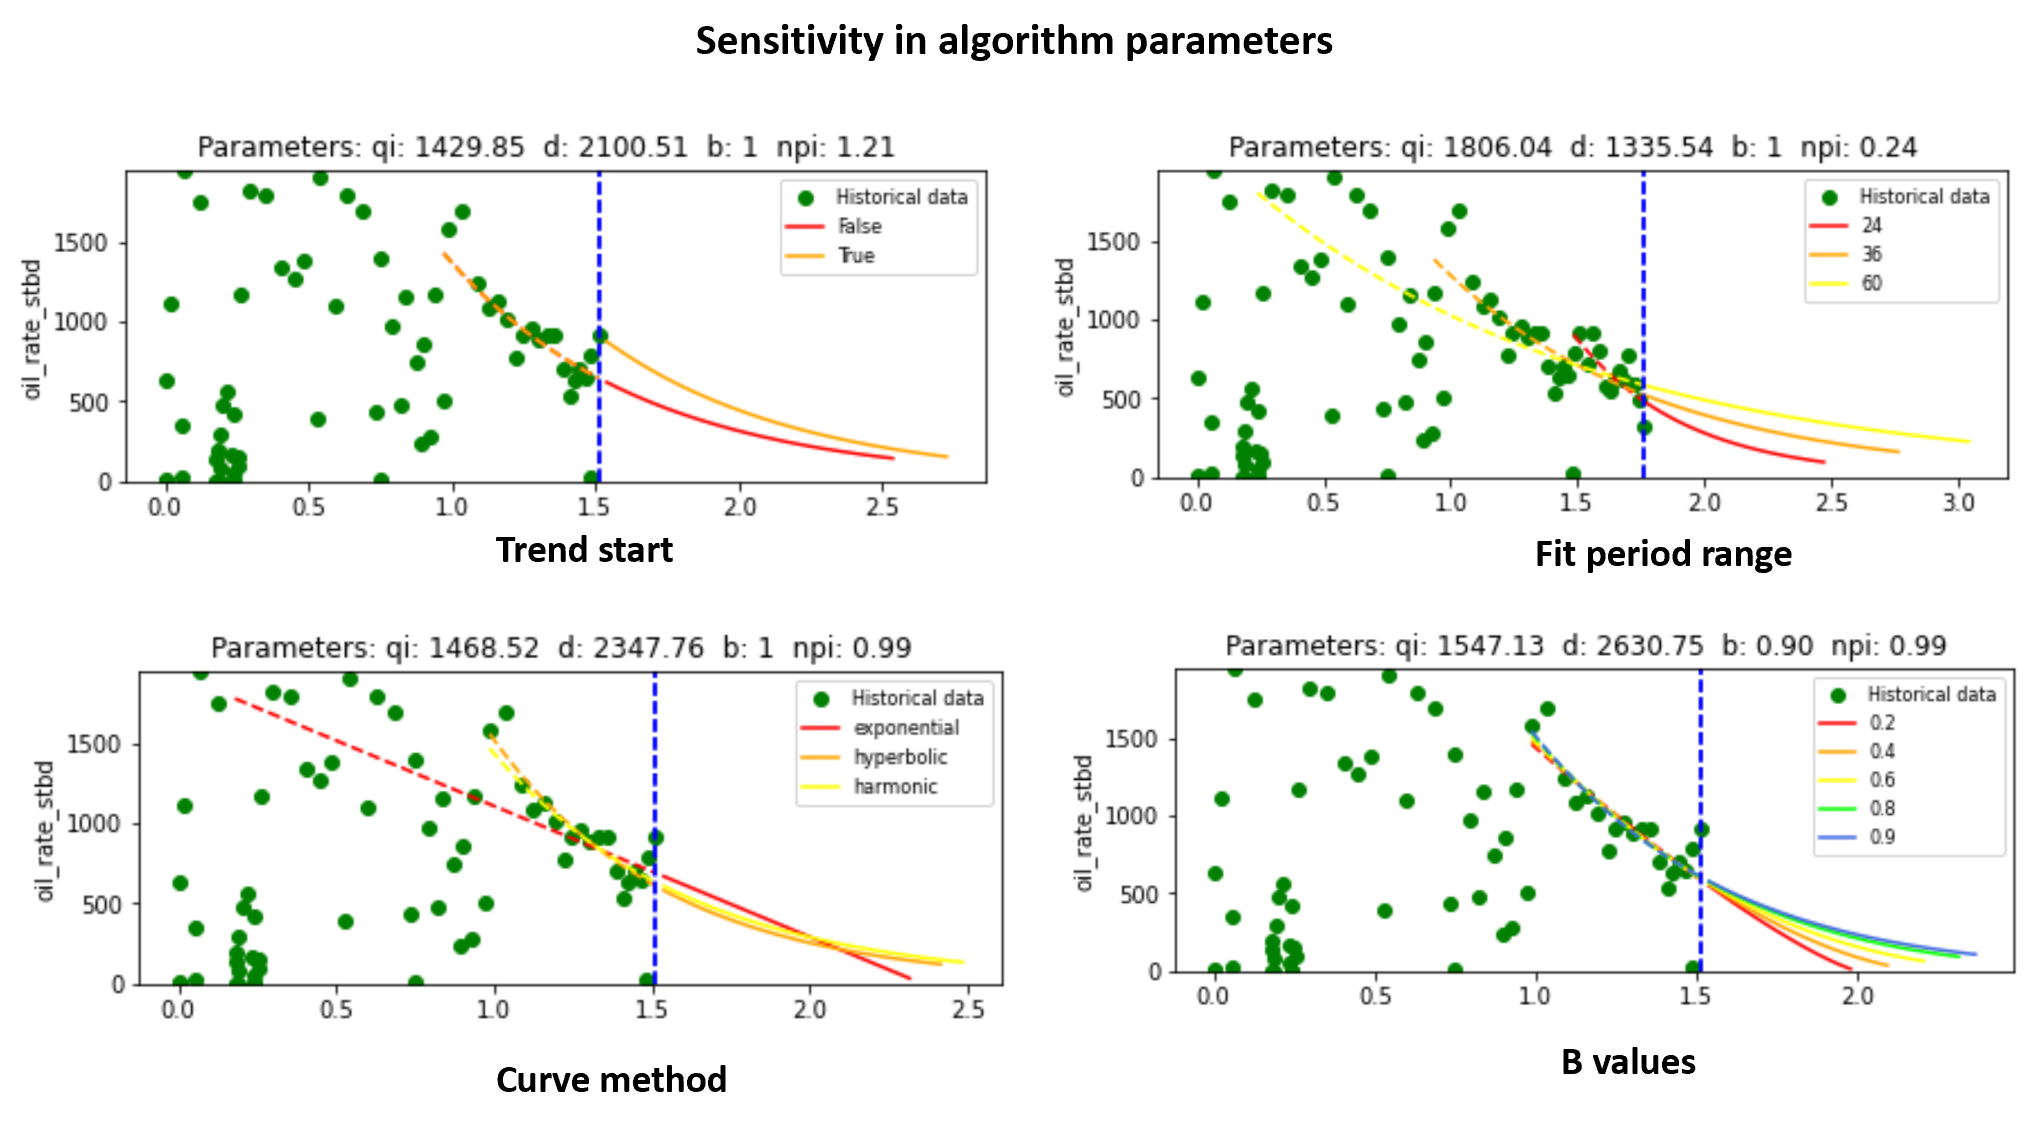
The following is an example of a sensitivity to the different DCA parameters
- For more information on the DCA, here are some useful links:
Internal GM:
(Link to GM EP RES 005)Petro-wiki: https://petrowiki.spe.org/Production_forecasting_decline_curve_analysis