Curve type
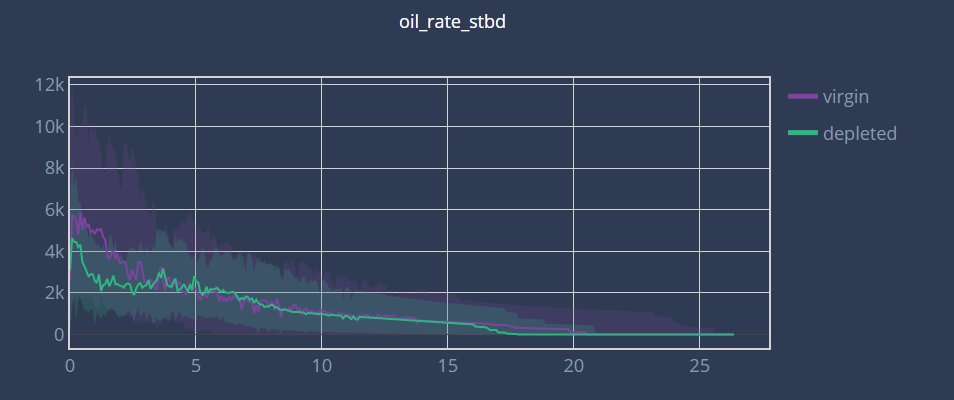
The curve type technique is used to represent the production profile for a group of well. You can choose any static field and compute the median for each group. You can also add a scattering around the curve by choosing different percentiles. We take the cumulative active days for X and the selected fluid for Y. To get the same X for all different wells, we set the range from 0 to the maximum cumulative active days of all the wells. Then we set to null if the well didn’t produce during this period. Finally, we make a linear interpolation of the well production each month considering his production (more clear ?). The cumulative active days are then converted to years.
If there are null values in the dataset we distinguish 2 cases : If the fluid forecasted is a cumulative or a ratio, we fill the null value with the last valid observation. Otherwise, the fluid forecasted is a rate and we consider the null values as 0.
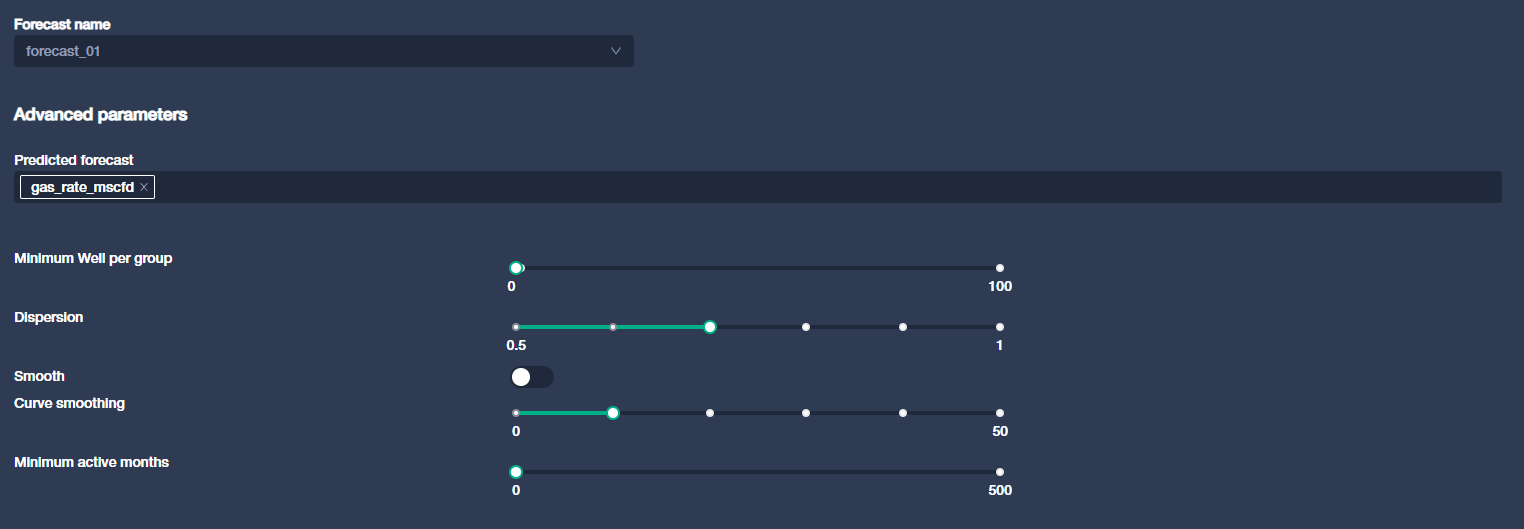
Parameters
Forecast name : Allows you to choose between all the forecasts you created
Category : Allows you to group the wells by all static fields in the dataset. By default, only one category with all wells is created.
Curve smoothing : ?
Dispersion : In addition of the P50, this allows you to plot an area disperion by selecting percentiles.
Minimum active months : set the minimum active months’ production for the wells to be considered in the curve types.
Minimum Well per group : Allows you to set a treshold, all the groups that have less wells will be in a group name “other”.