FRF Single Forecast Workflow
Version 1.0
The purpose of this workflow is to genreate a simple workflow of FRF and save the results that can be used for comparison and analysis It contains all the code snippets to be used for generate a blind test or forecast workflow Here are some guide lines: - (!) : Parameters are expected in the following box - Playground : Area to test and modify the result or generate alternatif runs
frf requierement needs to be installed - including frf lib dev version (pip install -e .)
### Module Import
[1]:
import numpy as np
import pandas as pd
import matplotlib.pyplot as plt
import logging
import os
import time
import pprint

from importlib import reload


%load_ext autoreload
%autoreload 2
[2]:
from frflib.forecast_methods import forecast_wf
from frflib.data_class import input_data
from frflib.plots.forecast_plots import plot_group_forecast
from frflib.plots.forecast_plots import *
#from frflib.fieldbox_lib.workflow_interactions import get_preset_wf
import datetime
from frflib.data_class.input_data import InputData
import inspect
import frflib
reload(forecast_wf)
ForecastWF = forecast_wf.ForecastWF
InputData = input_data.InputData
[3]:
PATH_FRFLIB= os.path.dirname(inspect.getsourcefile(frflib))
PATH_TO_DATA= os.path.join(PATH_FRFLIB,"sample_data")
The data source needs to be set up in order to read the production data. The data set needs to be in the frf inputdata format
(!) Project Info:
[4]:
# if you want to select a subset of the field data - you can filter as follow
category = 'reservoir'
value = 'Fluvial'
Data Import
[5]:
project_id="01"
wf_name="dataset_01_simple_wf"

WF_PATH=os.path.join(PATH_TO_DATA,f"{wf_name}.hdf")
DATA_PATH=os.path.join(PATH_TO_DATA,f"dataset_{project_id}.hdf")
[6]:
field_data = InputData.load_hdf(DATA_PATH)
wf = ForecastWF.load_from_hdf( WF_PATH, field_data)
field_data._compute_indicators()
wf.enrich_data()
field_data_enriched = wf.enriched_data
(!) Parameters
If the worklow is going to be applied on a subset of data. It can be extracted using the function subset or a well lsit
[7]:
field_data = field_data.subset(category = category, filt_value = value)
Number of processors available :
[8]:
nproc = 4
Workflow param:
Here are the setup for the workflow. It can be done either a blind test of forcast. The parameters are the following: - Forecast name - Forecast mode: - Blind Test: To be used in order to test a workflow on past data. The needed data are: - Blind test duration: in months - forecast_fluids - Forecast: - forecast_end_date - abandonned_wells - uptime_selection: - constant_value - period_for_avg_months - Simple contraints
[9]:
general_forecast_params ={
 'forecast_name': 'ref_wf_liq_cst_fonp',    # forecast reference Name
 'forecast_end_date': "01/01/2040",         # "dd/mm/yyyy"
 'forecast_fluids': ['oil',  'water'],      # ['oil',  'water', 'gas', 'liquid']
 'forecast_mode': 'forecast',               # 'forecast_mode': 'forecast', blind_test

#     Blind test
 'blind_test_duration': 120,                #  if forecast_mode is blind test - blind test duration


#     Foreward forecast                     #  if forecast_mode is forward
 'abandonned_wells': 12,                    #  wells closed during the last x months will be
 'uptime_selection': 'constant_value',      #  uptime computation method: constant_value or
 'constant_value': 1.0,
 'period_for_avg_months':12,                #
 'short_term_forecast_adjustment': 0,       # period to adjust linearly the trend to the last value (in months)
                                            # some methods like dca and analog will have some additional adj capabilities

#  constraints   - well level
 'eco_cut_off': 50,                       # economic cut off
 'max_liq_rate_stbd': None,                 # max liquid rate
 'max_gas_rate_mscfd': None,                # max gas rate
 'max_liq_from_history': None,              # max liquid rate

# constraints fields - NOT YET IMPLEMENTED
 'field_max_liq_rate_stbd': None,
 'field_max_water_stbd': None,
 'field_max_oil_stbd': None,
 'field_max_gas_rate_mscfd': None,
}
Methods:
Given the selected fluids, here is the list of the available methods in frflib. This list evolves regularely with news added methods. For additional information in every methods, you can contact FRF Team.
Not implemented the function ….get_help(…) will add some documentation
[10]:
list(ForecastWF.get_available_f_methods(general_forecast_params['forecast_fluids']).keys())
[10]:
['dca_oil',
 'analog_wells_oil',
 'cgr_cst',
 'curve_type_oil',
 'fitlearn_forecaster_oil',
 'bsw_fit',
 'analog_wells_bsw',
 'log_fo_fit',
 'adaptable_fo_fit',
 'bsw_cst',
 'wgr_cst',
 'curve_type_bsw',
 'dummy_forecaster_bsw',
 'fitlearn_forecaster_bsw']
Here are some preset example Methods:
[11]:
#get_preset_wf(general_forecast_params['forecast_fluids'])
(!)
or build your own. The methods list needs to be in the correct order of execution rate / ratio, Oil or liquid / water …
[12]:
Selected_methods = ['dca_oil', 'analog_wells_oil', 'adaptable_fo_fit', 'fitlearn_forecaster_bsw']
Playground
In the following, it is a playground area to generate more than one forecast with different parater
[13]:
# Method 1
wf_0_general_param = general_forecast_params.copy()
wf_0_general_param['forecast_name'] = 'dca_oil_anaolg'
Selected_methods = ['dca_oil','analog_wells_oil', 'log_fo_fit','analog_wells_bsw']
wf_0_methods_param = [ForecastWF.get_f_methods_default_param(method, field_data) for method in Selected_methods]
# Method 2
# wf_1_general_param = general_forecast_params.copy()
# wf_1_general_param['forecast_name'] = 'dca_oil_dummy_forecaster'
# Selected_methods = ['dca_oil','dummy_forecaster_oil', 'log_fo_fit','analog_wells_bsw']
# wf_1_methods_param = [ForecastWF.get_f_methods_default_param(method, field_data) for method in Selected_methods]
# # Method 3
# wf_2_general_param = general_forecast_params.copy()
# wf_2_general_param['forecast_name'] = 'dca_oil_fit_learn'
# Selected_methods = ['dca_oil','fitlearn_forecaster_oil', 'log_fo_fit','analog_wells_bsw']
# wf_2_methods_param = [ForecastWF.get_f_methods_default_param(method, field_data) for method in Selected_methods]
Here are the default parameters of the selected methods
[14]:
pprint.pprint(wf_0_methods_param)
[{'b_max': 1.0,
  'b_min': 0.0,
  'd_max': 100000.0,
  'd_min': 10,
  'fluid': ['oil'],
  'forecaster_name': 'dca_oil',
  'max_fit_points': 1000,
  'methods': 'hyperbolic',
  'min_fit_points': 18,
  'r2_min': 0.4,
  'shift_trend': True},
 {'fit_flag': False,
  'fluid': ['oil'],
  'forecaster_name': 'analog_wells_oil',
  'groupby_category': 'reservoir',
  'learn_x': 'cum_active_days',
  'neighbors_num': 4},
 {'beta_max': 1.0,
  'beta_min': 0.0,
  'bsw_fit_threshold': 0.2,
  'fluid': ['water'],
  'forecaster_name': 'log_fo_fit',
  'kernel_size': 3,
  'max_fit_points': 999,
  'min_bsw': 0.3,
  'min_fit_points': 9},
 {'fit_flag': False,
  'fluid': ['water'],
  'forecaster_name': 'analog_wells_bsw',
  'groupby_category': 'reservoir',
  'learn_x': 'cum_active_days',
  'neighbors_num': 4}]
[ ]:
Edit default parameters if needed:
[15]:
wf_0_methods_param[0]['b_max'] = 0.5
# wf_0_methods_param[1]['early_date_filter'] = '01/01/2000'
# wf_1_methods_param[1]['npi_to_avg_rate'] = 2500
# wf_1_methods_param[1]['dca_d'] = 400
# wf_2_methods_param[1]['groupby_var'] = 'reservoir'
# wf_2_methods_param[1]['early_date_filter'] = '01/01/2010'
# default_param_list[2]['min_bsw'] = 0.3
# default_param_list[2]['bsw_fit_threshold'] = 0.1
# default_param_list[1]['groupby_var'] = 'reservoir'
# default_param_list[2]['max_fit_points'] = 22
# default_param_list[3]['groupby_var'] = 'reservoir'
# datetime.strptime(wf_2_methods_param[1]['early_date_filter'], "%d/%m/%Y")
Summary of the workflow:
[16]:
pprint.pprint(wf_0_general_param)
{'abandonned_wells': 12,
 'blind_test_duration': 120,
 'constant_value': 1.0,
 'eco_cut_off': 50,
 'field_max_gas_rate_mscfd': None,
 'field_max_liq_rate_stbd': None,
 'field_max_oil_stbd': None,
 'field_max_water_stbd': None,
 'forecast_end_date': '01/01/2040',
 'forecast_fluids': ['oil', 'water'],
 'forecast_mode': 'forecast',
 'forecast_name': 'dca_oil_anaolg',
 'max_gas_rate_mscfd': None,
 'max_liq_from_history': None,
 'max_liq_rate_stbd': None,
 'period_for_avg_months': 12,
 'short_term_forecast_adjustment': 0,
 'uptime_selection': 'constant_value'}
[17]:
pprint.pprint(wf_0_methods_param)
[{'b_max': 0.5,
  'b_min': 0.0,
  'd_max': 100000.0,
  'd_min': 10,
  'fluid': ['oil'],
  'forecaster_name': 'dca_oil',
  'max_fit_points': 1000,
  'methods': 'hyperbolic',
  'min_fit_points': 18,
  'r2_min': 0.4,
  'shift_trend': True},
 {'fit_flag': False,
  'fluid': ['oil'],
  'forecaster_name': 'analog_wells_oil',
  'groupby_category': 'reservoir',
  'learn_x': 'cum_active_days',
  'neighbors_num': 4},
 {'beta_max': 1.0,
  'beta_min': 0.0,
  'bsw_fit_threshold': 0.2,
  'fluid': ['water'],
  'forecaster_name': 'log_fo_fit',
  'kernel_size': 3,
  'max_fit_points': 999,
  'min_bsw': 0.3,
  'min_fit_points': 9},
 {'fit_flag': False,
  'fluid': ['water'],
  'forecaster_name': 'analog_wells_bsw',
  'groupby_category': 'reservoir',
  'learn_x': 'cum_active_days',
  'neighbors_num': 4}]
Workflow
### Event handling for blind test
The worflow can be exrcuted. In case of blind test it is important to check that there is no intervention in the wells to be forecasted. For this to function, the field data needs to contains event information (in df_event) and taggued correctly in event group
(!) Optional: Define wells with events to be removed from
[18]:
event_list = ['stimulation']
[19]:
if general_forecast_params['forecast_mode']=='blind_test' and field_data.df_events is not None:
    wl = field_data.df_events.loc[field_data.df_events['event_group'].isin(event_list)].index.get_level_values(0).unique()
    field_data = field_data.subset(wl = wl)
Forecast execution
Here you can execute more than one forecast that you prepared in the playground area
[20]:
wf_0 = ForecastWF.execute(field_data,wf_0_general_param, wf_0_methods_param, nproc=1)
# wf_1 = ForecastWF.execute(field_data,wf_1_general_param, wf_1_methods_param, nproc=nproc)
# wf_2 = ForecastWF.execute(field_data,wf_2_general_param, wf_2_methods_param, nproc=nproc)
Results:
This section allows to represent the results at well and field scale You can visualize all the fluid available and all the wells. For this you need to select the workflow to visualize
(!)
[21]:
wf_list = [wf_0]
x_axis = 'date'  # Other options cumulative oil: oil_cum_mmbbl
plot_active_wells = 'all' # add in a secondary axis the plot of the active wells
                                   # possible values 'history_only' / 'all' / 'no_history'
[22]:
y_axis = 'oil_rate_stbd'
fig_field_oil_rate = plot_group_forecast(wf_list,
                                         x_axis=x_axis,
                                         y_axis =y_axis,
                                         plot_active_wells=plot_active_wells)
fig_field_oil_rate.show()
[23]:
y_axis = 'water_rate_stbd'
fig_field_water_rate = plot_group_forecast(wf_list,
                                         x_axis=x_axis, y_axis =y_axis, plot_active_wells=plot_active_wells)
fig_field_water_rate.show()
Other variable possible to vizualise: - Rates: liq_rate_stbd, gas_rate_mscfd - Potential: pot_oil_rate_stbd, pot_water_rate_stbd - Cumulative: oil_cum_mmbbl, … - Ratios: bsw_vv, gor_vv
Playground:
You can visualize for a subset of well either through list or from the results
[24]:
wl = list(wf_0.dict_wlist_fmethod['oil']['dca_oil']) # well teated by the forecaster dca_oil
# wl = [...,...]
[25]:
y_axis = 'bsw_vv'
fig_field_oil_rate = plot_group_forecast(wf_list,
                                         x_axis=x_axis,
                                         y_axis =y_axis,
                                         well_list=wl,
                                         plot_active_wells=plot_active_wells)
fig_field_oil_rate.show()
[26]:
y_axis = 'liq_rate_stbd'
fig_field_oil_rate = plot_group_forecast(wf_list,
                                         x_axis=x_axis,
                                         y_axis =y_axis,
                                         well_list=wl,
                                         plot_active_wells=plot_active_wells)
fig_field_oil_rate.show()
[27]:
y_axis = 'pot_water_rate_stbd'
fig = plot_group_forecast(wf_list, x_axis=x_axis,y_axis =y_axis,
                                         well_list=wl,
                                         plot_active_wells=plot_active_wells)
fig.show()
Additional plots
The following plots need to specify the fluid (oil / water / liquid / gas) that you want to plot
(!)
[28]:
fluid = 'oil'
Well number per method:
Shows the number of wells per forecast for a given fluid. You
[29]:
fig_method_wells = wf_0.plot_well_num_per_fmethod(fluid)
fig_method_wells.show()
Blind test plots:
[30]:
if general_forecast_params['forecast_mode'] == 'blind_test':
    fig_bt_wells = wf_0.plot_blind_test(fluid, well_list = None)
    fig_bt_wells.show()
[31]:
if general_forecast_params['forecast_mode'] == 'blind_test':
    fig_bt_error = wf_0.plot_bt_error( fluid,well_list = None,sort = True, error = 'absolute')
    fig_bt_error.show()
Export for web app:
[32]:
from frflib.utils.dataframe_func import df_fast_loc
[33]:
from frflib.plots.utils import (get_bar_data_single, get_count_per_method_single, get_result_summary_single,
                                get_bt_dict, get_bar_bt, get_bar_data_single, get_single_summary, get_scatter_bt)


is_new_wells = False
is_mult = False
is_blindtest = False

dict_single_summary = get_single_summary(wf_0, well_list = None)

result_dict = {}
result_dict['meta_data']  = {'is_new_wells': is_new_wells,'is_mult': is_mult,'is_blindtest': is_blindtest}

result_dict['well_count'] = get_count_per_method_single(dict_single_summary)
result_dict['result_summary'] =get_result_summary_single(dict_single_summary)

if is_blindtest:
    bt_dict = get_bt_dict(wf_0, well_list = None)
    result_dict['bt_scatter'] = get_scatter_bt(bt_dict)
    result_dict['bt_bar'] = get_bar_bt(bt_dict)
else:
    result_dict['fw_bar'] = get_bar_data_single(dict_single_summary)
[34]:
import json
def export_json(dict_plot, filename):
    with open(f"sample_data/{filename}", "w") as outfile:
        json.dump(dict_plot, outfile, default='convert')
[35]:
#export_json(result_dict, 'for_front_single_fw.json')
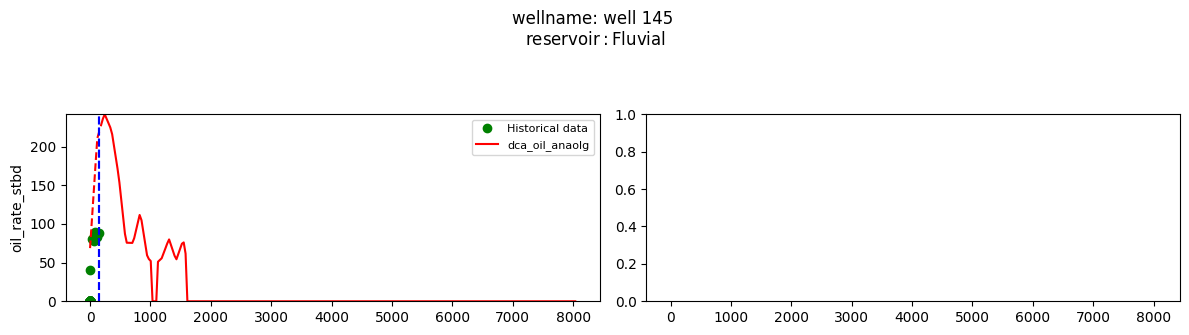
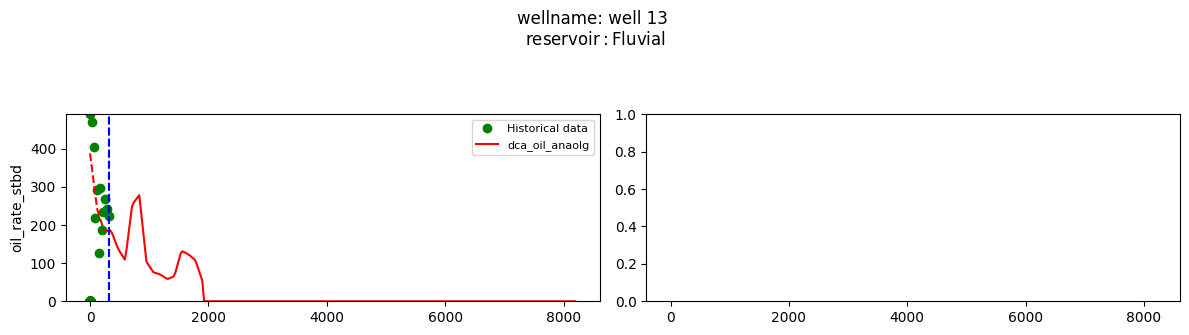
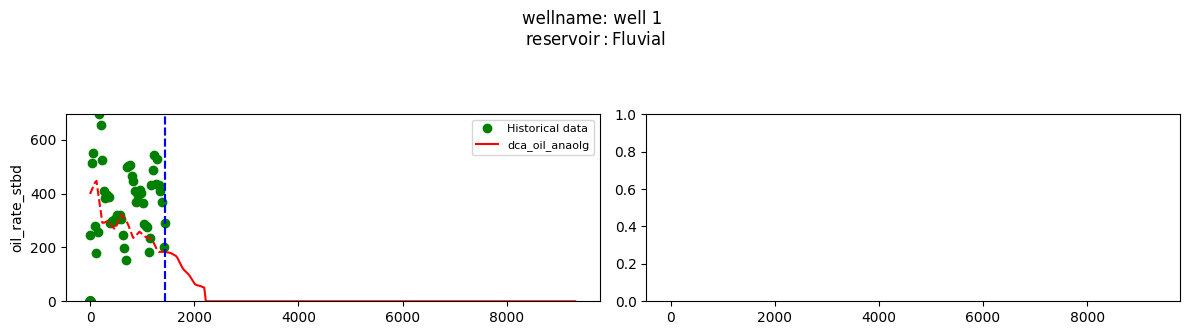
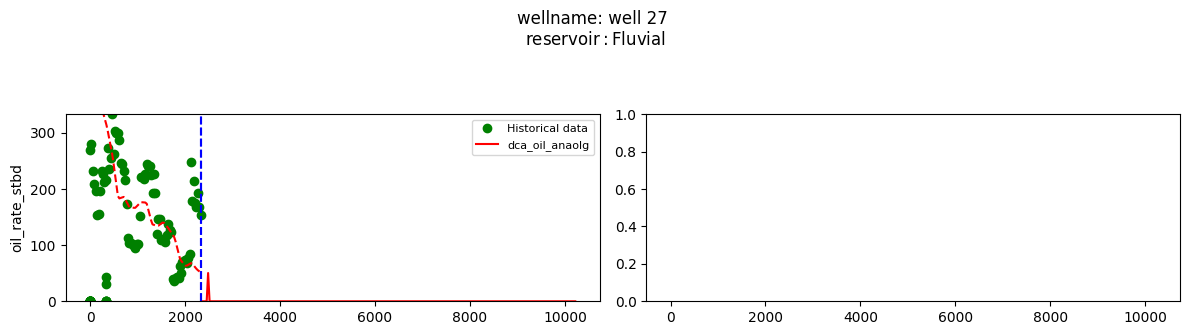
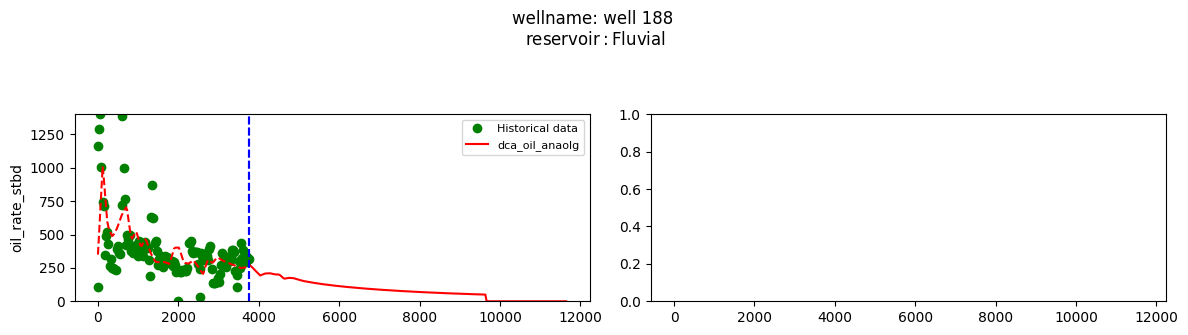
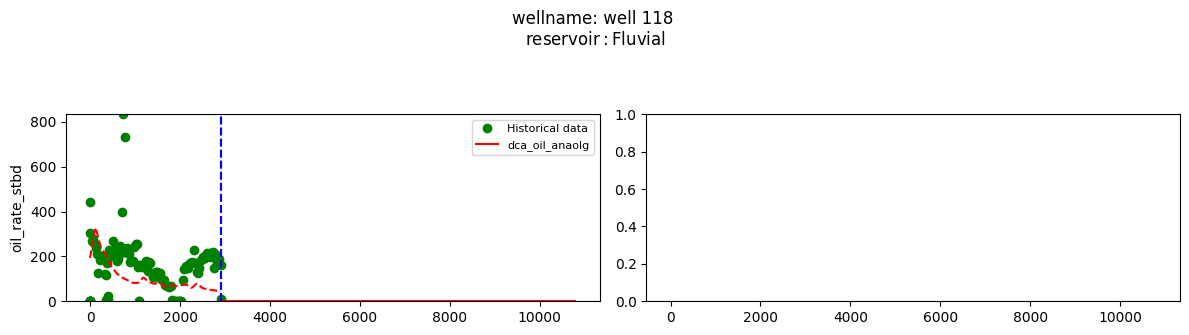
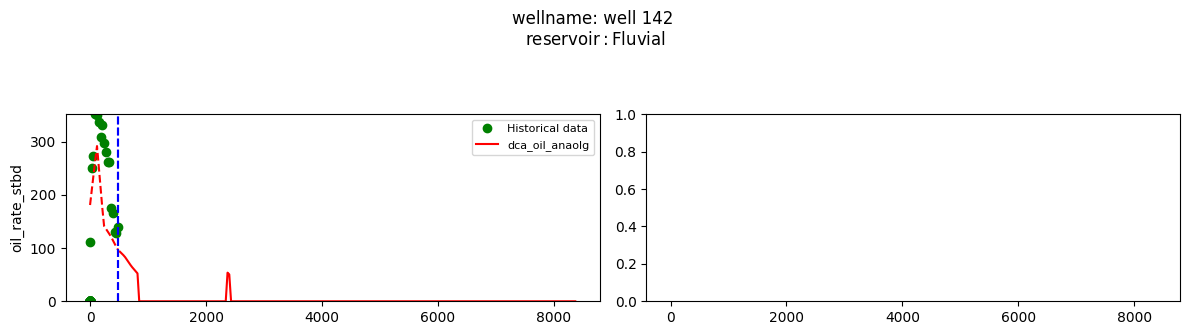
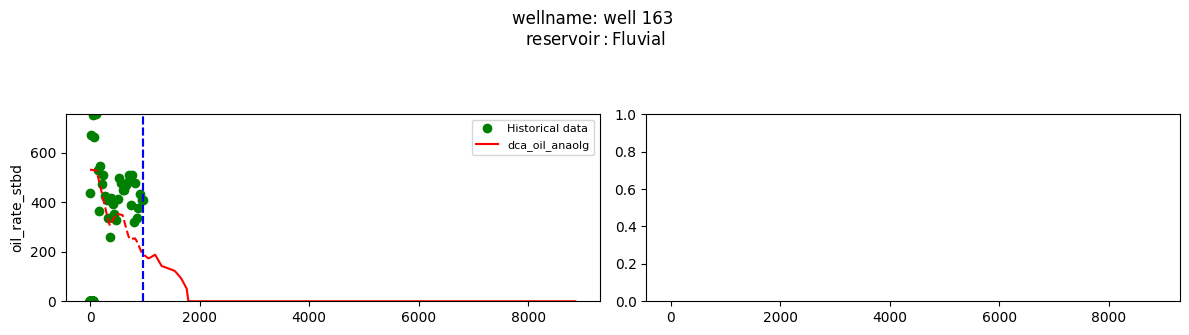
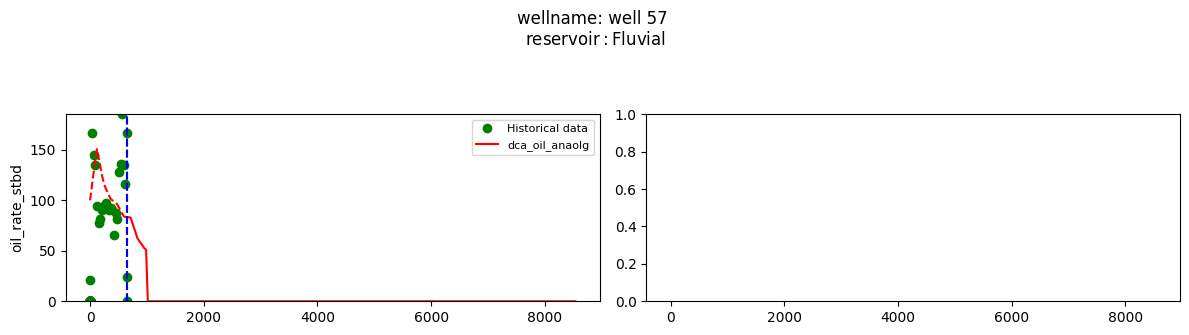
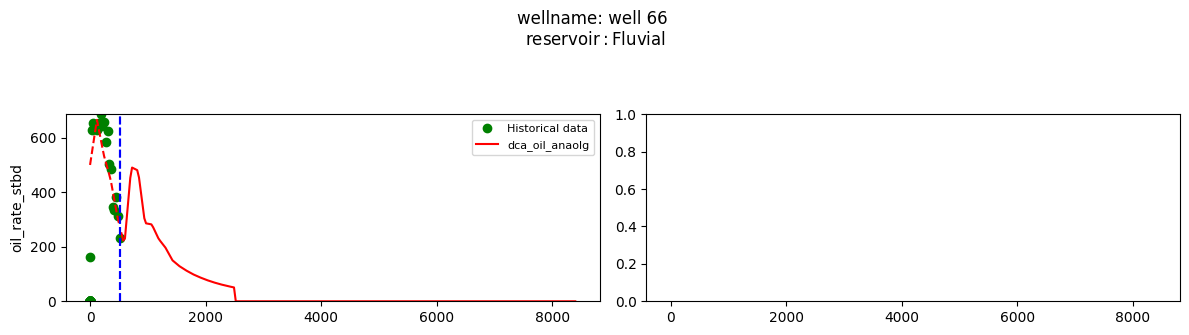
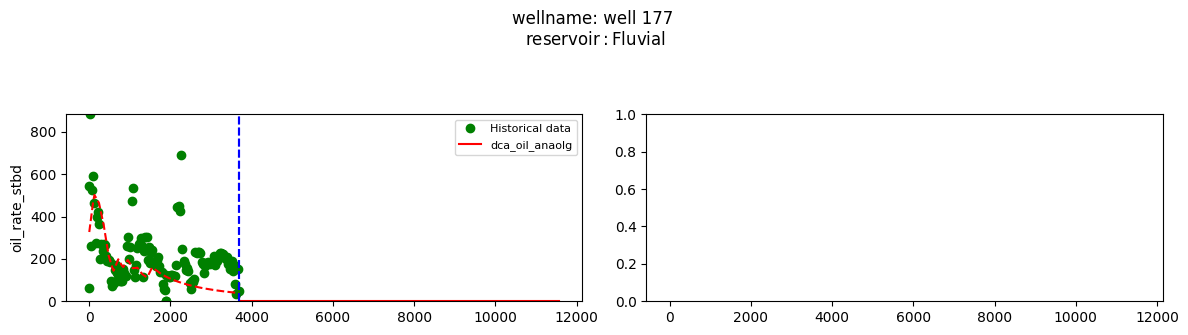
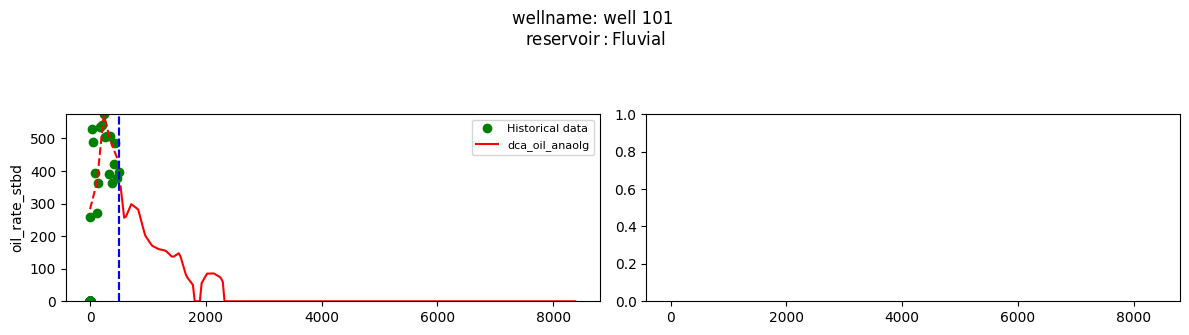
Well by well results
[36]:
wl = wf_0.dict_wlist_fmethod['oil']['analog_wells_oil']
[37]:
plot_wells(wf_list ,y_axis_list = ['oil_rate_stbd'],x_axis='cum_active_days', well_number = 20, static_info = ['reservoir'], well_list=wl)
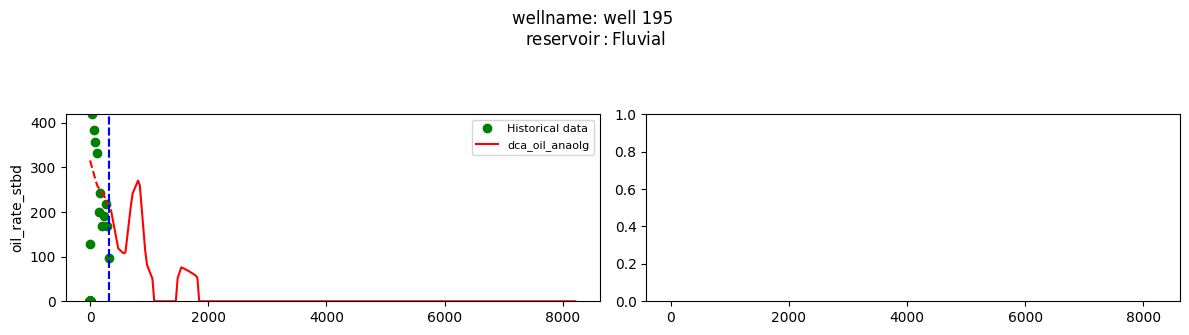
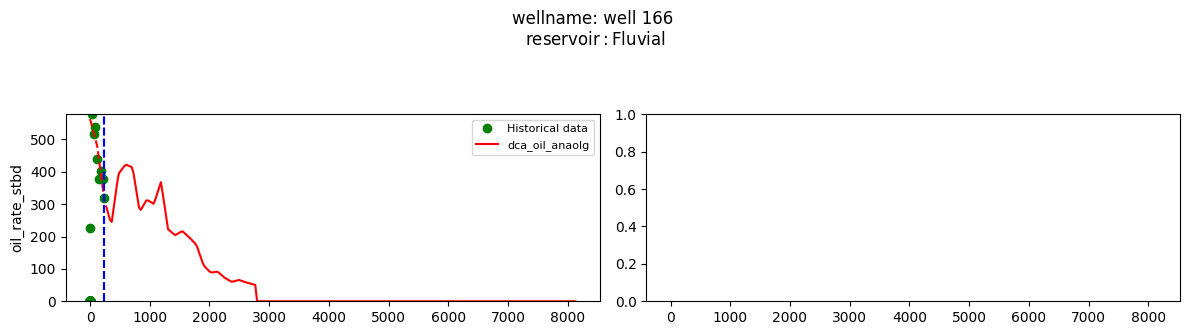
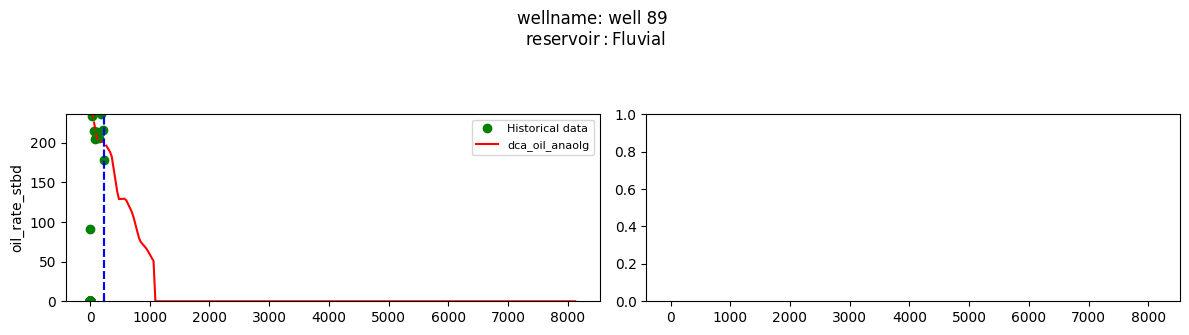
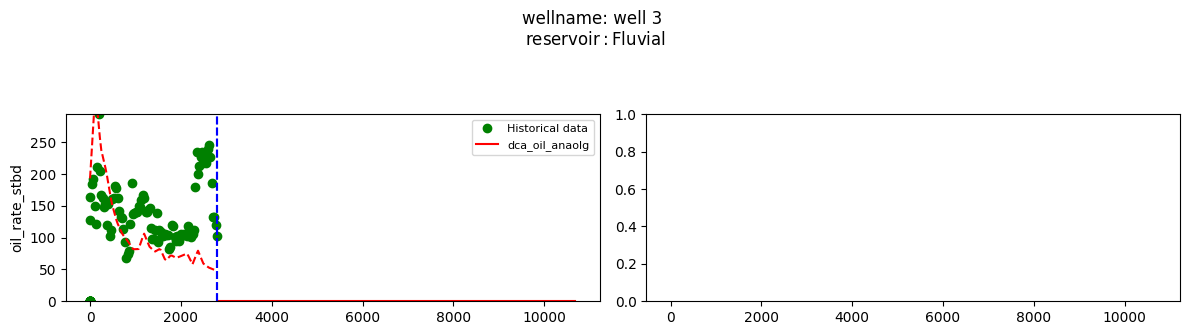
Extract results and parameters:
[38]:
df = wf_0.get_result_summary(include_stat=True)
df.head()
[38]:
| method | y_var | parameters | score | method_category | oil_uer_mmbbl | hist_oil_cum_mmbbl | rem_oil_uer_mmbbl | production_name | wellbore | ... | last_water_rate_stbd | last_liq_rate_stbd | last_gas_rate_mscfd | last_bsw_vv | last_gor_vv | init_oil_rate_stbd | init_gor_vv | Cum_Prod_EHO_15 | date_BSW_15 | Months_BSW15 | |
|---|---|---|---|---|---|---|---|---|---|---|---|---|---|---|---|---|---|---|---|---|---|
| wellname | |||||||||||||||||||||
| well_0 | 0 | 0 | 0 | 0.000000 | 0 | 0.000000 | 0.000000 | 0.000000 | 0 | 0 | ... | 0.712533 | 27.676957 | 6245.300000 | 0.025745 | 41250.201701 | 107.241327 | 10685.999999 | 0.000000 | 0 | 0.0 |
| well_1 | analog_wells_oil | [pot_oil_rate_stbd] | Index(['well_133', 'well_50', 'well_122', 'wel... | 0.162067 | analog_wells | 0.657545 | 0.568821 | 0.088724 | JD28 | JD28 | ... | 12.000000 | 302.900000 | 106600.000000 | 0.039617 | 65264.558267 | 337.664158 | 10006.748923 | 0.000000 | 0 | 0.0 |
| well_10 | dca_oil | [pot_oil_rate_stbd] | {'qi': 335.6906287532635, 'd': 5480.2717592188... | 0.880272 | fit | 0.118524 | 0.118524 | 0.000000 | SA29 | SA29_st1 | ... | 0.225806 | 3.193543 | 903.224391 | 0.070707 | 54204.347821 | 247.698681 | 13824.383960 | 0.081248 | 2013-09-01 00:00:00 | 25.0 |
| well_100 | closed | [pot_oil_rate_stbd, pot_water_rate_stbd] | {} | 1.000000 | closed_wells | 0.132563 | 0.132563 | 0.000000 | RA08 | RA08 | ... | 0.695987 | 0.726795 | 4.296455 | 0.957611 | 24837.864236 | 179.388475 | 13675.558928 | 0.000000 | 2009-03-01 00:00:00 | 0.0 |
| well_101 | analog_wells_oil | [pot_oil_rate_stbd] | Index(['well_80', 'well_112', 'well_133', 'wel... | 0.218708 | analog_wells | 0.507425 | 0.239892 | 0.267533 | JB32 | JB32_st1 | ... | 0.000000 | 398.133333 | 121466.666700 | 0.000000 | 54336.604172 | 384.116215 | 15025.127954 | 0.000000 | 0 | 0.0 |
5 rows × 63 columns
Play ground
This a free area to test a analyse the result. To fully use the frflib capactities dont hesitate to contact FRF team
[39]:
# example to access to a given forecast for additional analysis
forecaster = wf_0.dict_forecast_methods['oil']['dca_oil']
save worflow results
[40]:
workflow_to_export = wf_0
(!) export parameters:
[41]:
include_date = True
save_hdf = False

# csv export - Not fully implemented
save_csv_results = False
save_parameters = False
csv_file_format = 'frf' # phaser (Not yet implemented)
[42]:
f_period = str(int(workflow_to_export.wf_param['forecast_period']/12))+"y"
file_name = f"bt_{f_period}_{workflow_to_export.name}" if workflow_to_export.wf_param['forecast_mode'] == 'blind_test' else f'fw_{f_period}_{workflow_to_export.name}'# file_name = "test"

if include_date:
    DATE = datetime.datetime.today().strftime("%Y-%m-%d")
    EXPORT_NAME = f"{DATE}_{file_name}"
else:
    EXPORT_NAME = file_name

print(EXPORT_NAME)
2024-07-29_fw_21y_dca_oil_anaolg
[43]:
if save_hdf:
    EXPORT_NAME_hdf = f"{DATA_EXPORT_PATH + EXPORT_NAME}.hdf"
    workflow_to_export.save_to_hdf(EXPORT_NAME_hdf)

if save_csv_results:
    EXPORT_NAME_results_csv = f"{DATA_EXPORT_PATH + EXPORT_NAME}_data.csv"
    workflow_to_export.get_all_forecast().to_csv(EXPORT_NAME_results_csv)


if save_parameters:
    df = workflow_to_export.get_result_summary(include_stat=True)
    EXPORT_NAME_summary = f"{DATA_EXPORT_PATH + EXPORT_NAME}_summary.csv"
    df.to_csv(EXPORT_NAME_summary)

print('data exported')
print(EXPORT_NAME)
data exported
2024-07-29_fw_21y_dca_oil_anaolg
Create sample dataset for debugging:
Here is an area to create subset sampel for possible debugging
[44]:
# field_data_short = copy.deepcopy(field_data)
# all_wells = list(field_data.df_dynamic.index.get_level_values(0).unique())
# # wl = set(['SR-113', 'SR-231'] + all_wells[0:10])
# field_data_short.df_dynamic = field_data_short.df_dynamic.loc[list(wl)]
# field_data_short.df_static = field_data_short.df_static.loc[list(wl)]

# field_data_short.save_hdf('sample_data/bug_wells_for_petrocedeno.hdf')